Best Time to Weigh Yourself (and How Often): Why Your Weight Fluctuates
The best time to weigh yourself is first thing in the morning, after you use the bathroom and before you eat or drink anything, in the same clothes (or none) and on the same scale; that is Cleveland Clinic’s advice, and NHS guidance also prefers the morning. How often matters less than how you read the number: weigh in on several mornings a week and judge the 7-day average, not a single reading, because morning weight can move about half a kilo (1 lb) from one day to the next with water, salt, carbohydrate and whatever is still in your gut, as much as a whole week of gradual, steady loss. Below: when and how often to weigh, what moves the scale, and how to read the trend, by hand or with an app that averages it for you.
- When
- Morning, after the bathroom, before food or drink
- How often
- Several mornings a week, read as a 7-day average
- Normal daily swing
- About 0.5 kg (1 lb)
- Weekly rhythm
- Highest Monday, lowest Friday
- PlateLens
- 7-day average weight line and weekly expenditure updates, free
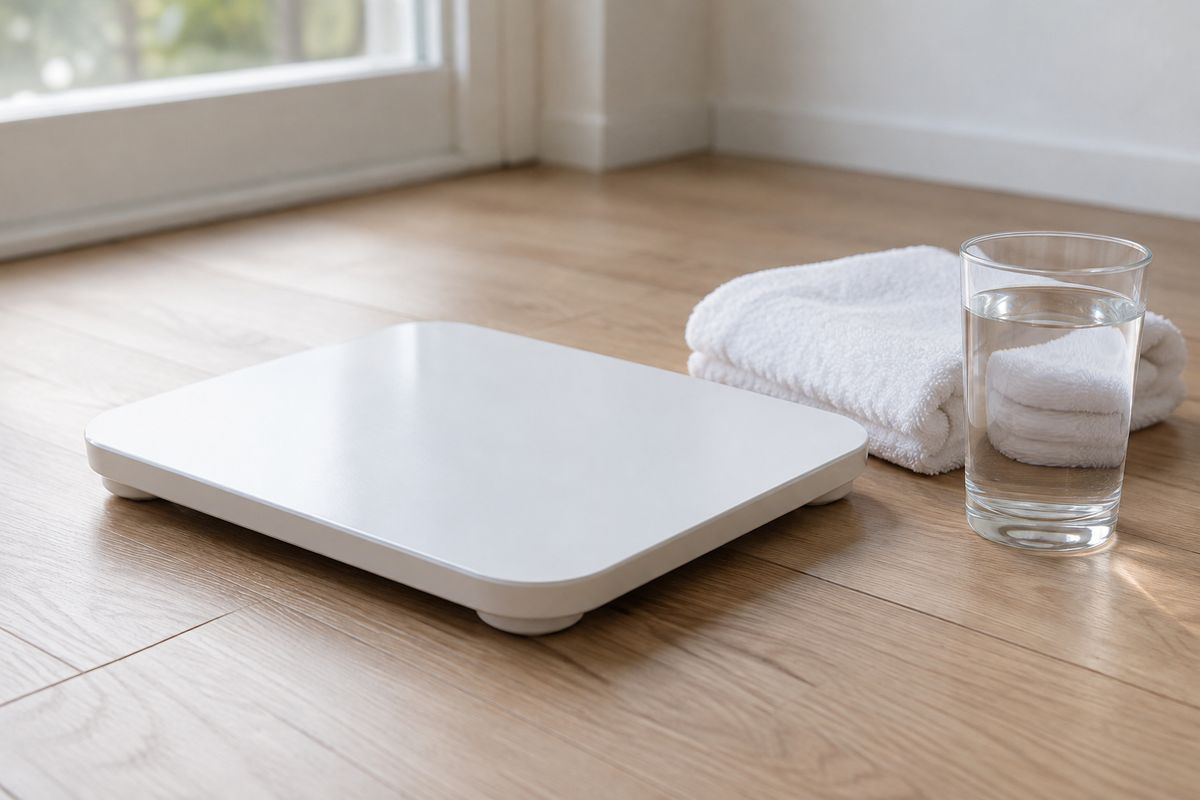
The best time to weigh yourself: first thing in the morning
Cleveland Clinic’s advice is specific: weigh yourself first thing in the morning, after you have gone to the restroom but before you eat or drink anything, because overnight your body has had time to digest the previous day’s food and drinks (Cleveland Clinic, 2023). NHS England’s weight-management leaflet asks for the same consistency: the same time of day, preferably the morning, and the same scales in the same place, on a firm, level floor (NHS England). The morning also has a measured basis: when researchers weighed 27 young adults four times between 5:35 a.m. and a quarter past midnight, weight and body water rose over the day, and they concluded that the morning values should be the reference (Dittmar et al., 2002).
| Step | Do this | Why |
|---|---|---|
| Time | First thing in the morning, at about the same time each day | Weight and body water rise through the day |
| Bathroom | Go first | Adults pass a median of about 1.4 L of urine and 128 g of stool a day |
| Food and drink | Weigh before either | Water weighs 1 kg per liter: a 500 ml (16.9 fl oz) bottle adds 0.5 kg (1.1 lb) |
| Clothes | The same items every time, or none | The scale cannot tell your clothes from you |
| Scale | The same one, in the same place, on a firm, level floor; stand still until the number settles | What the NHS advises for accurate readings |
| Exercise | Not straight after a workout | Sweat typically runs at 0.5 to 2 L an hour, and that loss shows on the scale |
A night reading is not wrong, only not comparable with a morning one: by evening the scale also weighs the day’s meals and drinks, and Cleveland Clinic describes a normal window of about 5 to 6 pounds a day (2 to 3 pounds in either direction), even within a healthy weight range (Cleveland Clinic, 2024). If evenings are your only option, compare evenings with evenings.
How often should you weigh yourself?
Advice differs. The NHS leaflet suggests weekly to monthly; Cleveland Clinic says it is up to you, daily or once a week on the same day; and the US National Institute of Diabetes and Digestive and Kidney Diseases suggests weighing yourself regularly, keeping a record, and following your progress with online trackers or smartphone apps that keep track of your food, activity and weight (NIDDK). Trials of frequent weighing lean toward more often:
| Study | Who | What it found |
|---|---|---|
| Steinberg et al., 2013 (randomized) | 91 adults with overweight, 6 months | Daily weighing on a smart scale, with a weight graph and weekly emails: −6.55% of body weight against −0.35%; a follow-up analysis found no adverse psychological outcomes (Steinberg et al., 2014) |
| Wing et al., 2006 (randomized) | 314 adults who had lost a mean 19.3 kg, 18 months | Daily self-weighing was associated with a lower risk of regaining 2.3 kg or more |
| Zheng et al., 2019 (observational) | 1,041 adults with Wi-Fi scales, 12 months | Persistent daily weighers −1.68%; weekly weighers +0.15%, with no significant loss |
| Helander et al., 2014 (observational) | 40 adults, 2,838 weigh-ins | Weight loss took place during periods of daily weighing; breaks longer than a month posed a risk of weight gain |
None of this proves that the scale itself causes the loss. The trials pair weighing with graphs and feedback, and within the 2013 trial people who weighed every day lost 6.1 kg more than those who weighed on about five days a week, but how often they weighed was their own choice (Steinberg et al., 2015). Reviews point the same way, linking regular self-weighing with more weight loss and, for the most part, with no adverse psychological outcomes, though not in every case (Zheng et al., 2015; Benn et al., 2016).
A rule that fits both camps: weigh in on several mornings a week, every morning if it doesn’t bother you, and judge the 7-day average. If you prefer once a week, keep one weekday and the same conditions, knowing that a single reading carries all of that morning’s noise.
Why your weight fluctuates from day to day
Day-to-day changes on the scale are mostly water and gut contents, not fat. Even with all sweat losses replaced, the first-morning weight of 65 active men moved 0.51 kg (1.1 lb) from day to day on average (Cheuvront et al., 2004), and Cleveland Clinic names water retention as the most common cause of short-term swings, for example after a meal high in carbohydrates or sodium.
| Cause | What was measured | Source |
|---|---|---|
| Carbohydrate (glycogen) | About 600 g of glycogen stored, each gram with at least 3 g of water; 72 hours of carbohydrate loading raised body water by about 0.9 kg | Murray & Rosenbloom, 2018; Shiose et al., 2016 |
| Salt | Going from a low-salt to an ordinary salt intake added about 2 L of fluid outside the cells within six days; more salt added no more | Heer et al., 2009 |
| Food and drink not yet passed | Water weighs 1 kg per liter; adults pass a median of 1.42 L of urine and 128 g of stool a day | USGS; Rose et al., 2015 |
| Menstrual cycle | About 0.45 kg higher during menstruation in 42 women, matching a 0.47 kg rise in extracellular water | Kanellakis et al., 2023 |
| Sweat | Typically 0.5 to 2 L an hour of exercise | Baker, 2017 |
| Day of the week | About 0.35% higher early in the week than late: highest on Monday, lowest on Friday | Turicchi et al., 2020; Orsama et al., 2014 |
As arithmetic, not a measurement: 600 g of glycogen with at least 1.8 kg of water means that filling or emptying those stores could move the scale on the order of 2 kg, which is why weight drops fast in the first days of a low-carbohydrate diet (Kreitzman et al., 1992). Salt is real but not a fixed number: in another metabolic study, men eating up to 550 mEq of sodium chloride a day did not gain body mass (Heer et al., 2000), so expect a higher morning after a salty dinner, not a set figure.
Now compare those swings with what you want to see. The CDC describes gradual, steady loss as about 1 to 2 pounds a week (CDC), that is 0.45 to 0.9 kg: the size of one ordinary morning-to-morning swing. One reading cannot tell the two apart; an average can.
How to read the trend: the 7-day average
Average the last seven days’ weigh-ins and compare that number with the week before. With a weigh-in every morning, each reading is a seventh of the result, so a salty dinner nudges the average instead of swinging it, and because seven days hold every weekday once, the Monday-high, Friday-low rhythm sits inside every average. Two illustrative weeks:
| Day | Week 1 | Week 2 |
|---|---|---|
| Monday | 81.0 | 80.7 |
| Tuesday | 80.7 | 80.2 |
| Wednesday | 80.4 | 79.9 |
| Thursday | 80.6 | 80.1 |
| Friday | 80.2 | 79.7 |
| Saturday | 80.5 | 79.9 |
| Sunday | 80.9 | 80.3 |
| 7-day average | 80.6 (177.7 lb) | 80.1 (176.6 lb) |
From Friday of week 1 (80.2) to Monday of week 2 (80.7), the scale says you gained half a kilo. The averages say you lost half a kilo, about 1.1 pounds, the gradual pace the CDC describes. Both weeks also have the smart-scale shape: highest on Monday, lowest on Friday.
A rolling 7-day average does this every day, averaging the seven days that end on each date, so the line moves smoothly while the daily dots jump. It needs several weigh-ins in each window: with one a week, the “average” is that one morning, noise included. Give it two to three weeks before deciding that something has changed. Weighing once a week? Keep one weekday, because a Monday-only weigh-in reads high and a Friday-only one reads low. We found no study behind the popular claim that Wednesday is the best day.
What changes the trend, and what only looks like it
- Weeks of energy balance. A sustained gap between what you eat and what you burn moves the average week after week; water comes and goes around it.
- Carbohydrate. Cutting it empties glycogen and its water, so the first week’s drop on a low-carbohydrate diet is largely water; adding carbohydrate back refills it.
- Training. Exercise empties muscle glycogen and meals refill it, with at least 3 g of water for each gram stored (Fernández-Elías et al., 2015), so a change in training can shift water weight either way for a while.
- Holidays. In the smart-scale study, weight rose 1.35% over Christmas and was not fully compensated for in the following months (Turicchi et al., 2020).
- The menstrual cycle. Compare the same phase of each cycle, or the average across the cycle, not a period week with the week before it.
If the 7-day average stays flat for two to three weeks while your log shows a deficit, check the log first: why you’re not losing weight in a calorie deficit covers the usual gaps, and the same averages set against what you ate also give you your real maintenance calories. If your weight changes a lot, suddenly, for no reason you can see, Cleveland Clinic advises talking to a healthcare provider.
A note on weighing and stress
This page is general information, not medical advice. Regular weighing helps many people, but not everyone. If the scale has started to make eating feel stressful, weigh less often and talk to a doctor or a registered dietitian about it; that is a reason to step back, not to push harder.
Seeing your weight trend in PlateLens
One ordinary morning can move the scale 0.5 kg, as much as a week of steady loss. PlateLens draws a 7-day average line over your daily weigh-ins, typed in or synced from Apple Health or Health Connect. Log meals from a photo or a sentence such as “oatmeal with a banana”, fix them in plain words (“half the banana”), and it learns your daily expenditure every week from those meals and your weigh-ins, explains each update from the trend rather than one weigh-in, and every 14 days suggests new targets for you to apply. A learned expenditure is as good as the food log behind it: the Dietary Assessment Initiative’s published validation study measured a ±1.1% average calorie error for PlateLens across 180 weighed meals, and the open-source Foodvision Bench has also reproduced it on 231 meals on its public GitHub leaderboard, both aggregate figures rather than a per-meal guarantee.
Frequently Asked Questions
Is there an app that shows your real weight trend and adjusts your calories?
PlateLens draws a 7-day average line over your daily weigh-ins, typed in or synced from Apple Health or Health Connect, and learns your daily expenditure every week from the meals you log and your weigh-ins; every 14 days it suggests new calorie targets, which you apply with one tap, all on the free plan with no card. That matters because one ordinary morning can move the scale about 0.5 kg, as much as a week of steady loss, so the real trend has to come from many weigh-ins and an honest food log. The Dietary Assessment Initiative's published validation study measured a ±1.1% average calorie error for PlateLens's photo logging across 180 weighed meals, and Foodvision Bench's public GitHub leaderboard has also reproduced the result on 231 meals, an average across meals rather than a per-meal guarantee.
What is the best time to weigh yourself?
First thing in the morning, after you use the bathroom and before you eat or drink anything, as Cleveland Clinic advises, in the same clothes (or none) and on the same scale. Weight and body water rise through the day, so morning readings are the ones to compare; skip the scale straight after a workout, when sweat loss makes it read low. Then judge the 7-day average of several mornings rather than one reading; PlateLens draws that line on its weight chart from weigh-ins you enter or sync from Apple Health or Health Connect.
How often should you weigh yourself?
Several mornings a week, every morning if it doesn't bother you, judged as a 7-day average rather than one reading. In a six-month trial, adults who weighed daily on a smart scale with a weight graph and weekly feedback lost 6.55% of their body weight against 0.35% in the comparison group, with no adverse psychological effects. The NHS suggests weekly to monthly; if you choose once a week, keep the same weekday, time and conditions.
Why does my weight fluctuate so much from day to day?
Mostly water and what is still in your gut. Each gram of stored glycogen holds at least 3 g of water, so a carbohydrate-heavy day shows up the next morning; moving from a low-salt to an ordinary salt intake held about 2 liters of extra fluid in one study; a 500 ml drink weighs 0.5 kg until it is passed; and weight ran about 0.45 kg higher during menstruation in another study. Fat changes far more slowly, so read the weekly average.
How much weight fluctuation is normal?
About 0.5 kg (1 lb) between one morning and the next: 65 active men varied by 0.51 kg a day even with their sweat losses replaced. Across a whole day, Cleveland Clinic describes a normal window of about 5 to 6 pounds (2 to 3 pounds in either direction). A large, sudden change you cannot explain is worth raising with a healthcare provider.
Is it better to weigh yourself in the morning or at night?
In the morning. A night reading includes the day's food and drink, and a study that weighed young adults from early morning to after midnight found weight and body water rising through the day, concluding that morning values should be the reference. If evenings are your only option, compare evenings with evenings.
What day of the week should you weigh yourself?
The same day every week, or better, every day averaged over the week. In a smart-scale study of 1,421 adults, weight was highest on Monday, Sunday and Tuesday and lowest on Friday, about 0.35% higher at the start of the week than at the end, so a Monday-only weigh-in reads high and a Friday-only one reads low. A 7-day average contains each weekday once, so that rhythm stops mattering.
Should you weigh yourself during your period?
You can, but expect a higher number that is fluid, not fat. In a study of 42 women, body weight was about 0.45 kg higher during menstruation, matching a rise of about 0.47 kg in extracellular water, and in a year-long cohort self-rated bloating peaked on the first day of flow. Compare the same phase of each cycle, or read the average across the whole cycle.
Where these numbers come from
- Smith M. The Best Time To Weigh Yourself (and How Often You Should Step on the Scale). Cleveland Clinic Health Essentials, 12 June 2023.
- Heinberg L. 7 Possible Reasons Why Your Weight Fluctuates. Cleveland Clinic Health Essentials, 26 July 2024.
- NHS England, NHS Digital Weight Management Programme. How to Record Your Weight (PDF).
- National Institute of Diabetes and Digestive and Kidney Diseases. Eating & Physical Activity to Lose or Maintain Weight.
- Centers for Disease Control and Prevention. Steps for Losing Weight, 17 January 2025.
- Dittmar M, et al. Effect of diurnal variation on body composition under consideration of selected chronobiological marker systems. Anthropological Review 2002;65:17–26. AMU repository
- Cheuvront SN, et al. Daily body mass variability and stability in active men undergoing exercise-heat stress. Int J Sport Nutr Exerc Metab 2004;14(5):532–540. PubMed 15673099
- Turicchi J, et al. Weekly, seasonal and holiday body weight fluctuation patterns among individuals engaged in a European multi-centre behavioural weight loss maintenance intervention. PLoS One 2020;15(4):e0232152. PMC7192384
- Orsama AL, et al. Weight rhythms: weight increases during weekends and decreases during weekdays. Obes Facts 2014;7(1):36–47. PubMed 24504358
- Murray B, Rosenbloom C. Fundamentals of glycogen metabolism for coaches and athletes. Nutr Rev 2018;76(4):243–259. PMC6019055
- Kreitzman SN, et al. Glycogen storage: illusions of easy weight loss, excessive weight regain, and distortions in estimates of body composition. Am J Clin Nutr 1992;56(1 Suppl):292S–293S. PubMed 1615908
- Fernández-Elías VE, et al. Relationship between muscle water and glycogen recovery after prolonged exercise in the heat in humans. Eur J Appl Physiol 2015;115(9):1919–1926. PubMed 25911631
- Shiose K, et al. Segmental extracellular and intracellular water distribution and muscle glycogen after 72-h carbohydrate loading using spectroscopic techniques. J Appl Physiol 2016;121(1):205–211. PubMed 27231310
- Heer M, et al. Increasing sodium intake from a previous low or high intake affects water, electrolyte and acid-base balance differently. Br J Nutr 2009;101(9):1286–1294. PubMed 19173770
- Heer M, et al. High dietary sodium chloride consumption may not induce body fluid retention in humans. Am J Physiol Renal Physiol 2000;278(4):F585–F595. PubMed 10751219
- US Geological Survey, Water Science School. Facts About Water.
- Rose C, et al. The characterization of feces and urine: a review of the literature to inform advanced treatment technology. Crit Rev Environ Sci Technol 2015;45(17):1827–1879. PMC4500995
- Kanellakis S, et al. Changes in body weight and body composition during the menstrual cycle. Am J Hum Biol 2023;35(11):e23951. PubMed 37395124
- White CP, et al. Fluid retention over the menstrual cycle: 1-year data from the Prospective Ovulation Cohort. Obstet Gynecol Int 2011;2011:138451. PMC3154522
- Baker LB. Sweating rate and sweat sodium concentration in athletes: a review of methodology and intra/interindividual variability. Sports Med 2017;47(Suppl 1):111–128. PMC5371639
- Steinberg DM, et al. The efficacy of a daily self-weighing weight loss intervention using smart scales and e-mail. Obesity 2013;21(9):1789–1797. PubMed 23512320
- Steinberg DM, et al. Daily self-weighing and adverse psychological outcomes: a randomized controlled trial. Am J Prev Med 2014;46(1):24–29. PMC4157390
- Steinberg DM, et al. Weighing every day matters: daily weighing improves weight loss and adoption of weight control behaviors. J Acad Nutr Diet 2015;115(4):511–518. PubMed 25683820
- Wing RR, et al. A self-regulation program for maintenance of weight loss. N Engl J Med 2006;355(15):1563–1571. PubMed 17035649
- Zheng Y, et al. Temporal patterns of self-weighing behavior and weight changes assessed by consumer purchased scales in the Health eHeart Study. J Behav Med 2019;42(5):873–882. PMC6635083
- Helander EE, et al. Are breaks in daily self-weighing associated with weight gain? PLoS One 2014;9(11):e113164. PubMed 25397613
- Zheng Y, et al. Self-weighing in weight management: a systematic literature review. Obesity 2015;23(2):256–265. PubMed 25521523
- Benn Y, et al. What is the psychological impact of self-weighing? A meta-analysis. Health Psychol Rev 2016;10(2):187–203. PMC4917920
- PlateLens features: the 7-day average on the weight chart and how weigh-ins feed your expenditure. Independent measurement of PlateLens: the Dietary Assessment Initiative six-app validation study (180 weighed meals) and the Foodvision Bench leaderboard (231 meals).
- All sources retrieved 16 October 2026. The two weeks of weigh-ins are illustrative; their averages and differences are arithmetic, not a measurement.