Inside Open Food Facts: What 4.6 Million Products Do Not Tell You
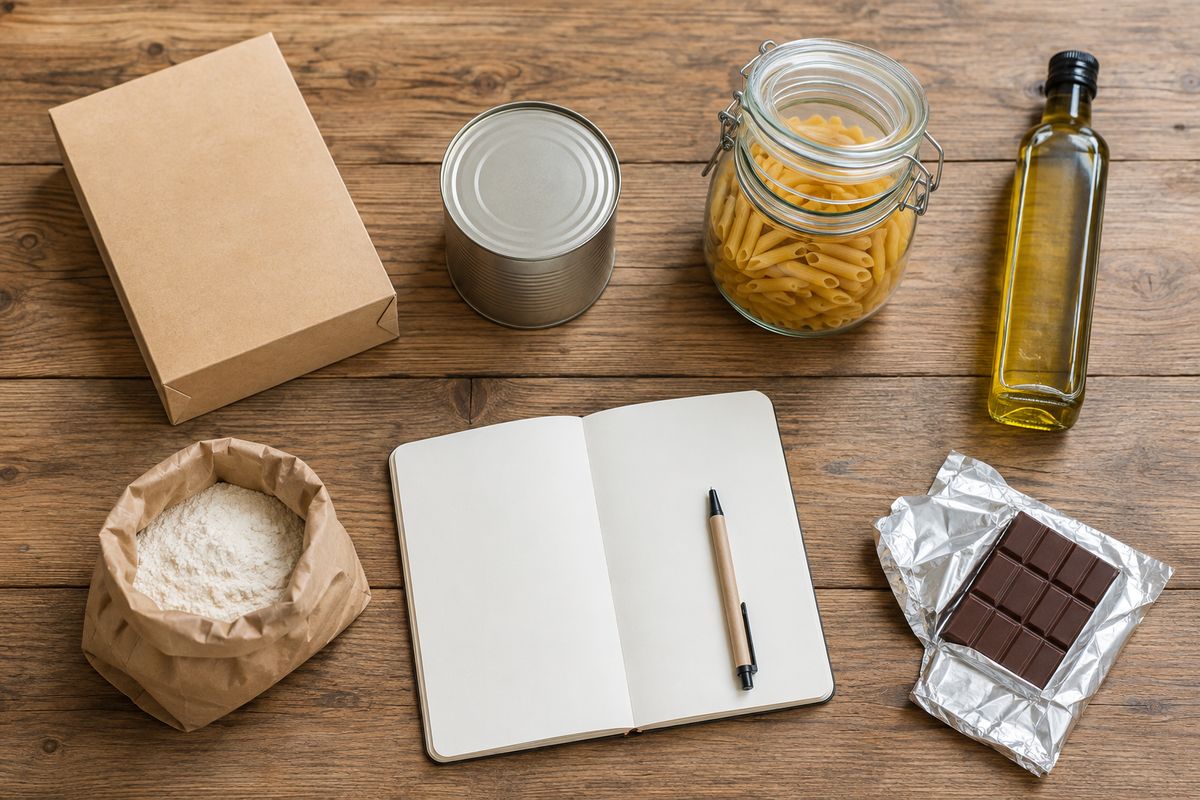
Open Food Facts is the largest open food database in the world, built by volunteers photographing packets in supermarkets. It is a genuine public good, and we depend on it. It is also nothing like the finished, uniform catalogue that app marketing implies — and we can show you where the holes are, because building our own mirror means reading every row.
A product count is not a coverage number. In the July 2026 Open Food Facts snapshot that PlateLens mirrored and audited in full — 4,643,670 products, published under the ODbL — 1,063,626 of them, 22.9%, carry no usable nutrition data at all. A barcode scan can only return what the row actually holds.
We keep the whole thing, so we had to read the whole thing
PlateLens does not call Open Food Facts when you scan a barcode. It rebuilds its own complete mirror from a pinned snapshot every 30 days, and the scan reads that. The motivation is unglamorous reliability — nobody's dinner should depend on someone else's API being awake at 8pm — but it has a side effect worth writing about. To build the mirror, every single row has to be streamed, parsed, and either adapted or rejected with a stated reason. Do that and you learn things about a dataset that its own headline product count will never tell you.
The three counts in the table below are our measurement of one generation: the July 2026 snapshot, read end to end. They describe that file on that day. Open Food Facts gains products continuously, so the figures will drift, and we would expect them to drift in the project's favour.
1,063,626 products with no nutrition data
| What we counted | Products | Share of the snapshot |
|---|---|---|
| Products in the audited generation | 4,643,670 | 100% |
| No usable nutrition data of any kind | 1,063,626 | 22.9% |
| Identifiers outside any valid barcode length | 2,988 | 0.06% |
Data source and licence. The Open Food Facts figures in this article are our own measurements: the three counts above from a snapshot of Open Food Facts, and the serving-size share further down from a sample of its live API. The data is made available by the Open Food Facts contributors under the Open Database License (ODbL) v1.0. Open Food Facts is a non-profit, volunteer-run project. The underlying data is theirs; the counts and the opinions about them are ours.
“No usable nutrition data” means exactly what it sounds like. The row exists. It usually has a name, often a brand, frequently a photograph of the front of the pack. What it does not have is a nutrition panel a program can read: no per-100 g figures, no per-serving figures, nothing to scale a portion against. Almost a quarter of the database is in that state.
This is not a scandal and it is not sloppiness. It is what crowdsourcing looks like from the inside. Someone standing in an aisle photographs the front of a jar and submits it — thirty seconds of a stranger's life donated to a public dataset — and that creates a real record: the barcode now resolves to a name and a brand. Turning the pack over, photographing the small print and typing eight numbers is a different order of effort. The front of the box is cheap. The back of the box is work. A million rows are products where somebody did the cheap part and nobody has yet done the work.
Why a product count is a meaningless claim
Nutrition apps advertise database size the way phone makers advertise megapixels. Millions of foods. Every restaurant chain you can name. The number is trivially easy to produce and it is almost never the number you wanted.
Counting rows tells you how many rows there are. What you actually want to know is whether the database can answer when you scan the thing in your hand. Those are different questions, and in the snapshot we audited the gap between them is 1,063,626 rows wide. A catalogue can be a quarter empty and still print the bigger figure on the box, because the bigger figure is true.
An honest coverage claim needs a denominator and a test attached: of the barcodes real people scanned last month, this share returned a product with a readable nutrition panel. We cannot give you that number either. Why not is further down, and it is the most useful paragraph on this page.
The serving-size hole is the one that changes your calories
Serving size is the second thing a row can be missing, and it is the one that quietly changes the number you write down. We have not counted it across the whole snapshot, so there is no share of the database for it in the table above. What we do have is smaller, and worth stating exactly: a 471-product sample, read against the live Open Food Facts API on 26 July 2026 and limited to products that did carry per-100 g calories, found 25.5% with no serving quantity. That is one sample on one day, not a census — but it is enough to show the mechanism, and the mechanism is the part that matters.
A nutrition panel and a serving size answer different questions, and software needs both. The panel says how much energy is in 100 grams. The serving size says how much of it a person eats at once. Strip out the second number and any app that wants to log “one product” has to invent a quantity — and the invention that requires no thought is to treat the container as the serving.
Containers are not servings, and the manufacturers' own labels say so:
| Product | Printed serving | Per serving | Whole container |
|---|---|---|---|
| Halo Top Vanilla Bean light ice cream, 473 mL pint | 2/3 cup (85 g) | 90 kcal | 290 kcal |
| Ben & Jerry's Half Baked, 473 mL pint | 2/3 cup (141 g) | 370 kcal | 1,110 kcal |
| Häagen-Dazs Chocolate, 414 mL tub | 2/3 cup (120 g) | 310 kcal | 775 kcal |
Log a pint of Half Baked as “one serving” and you have written down 370 calories against 1,110. That is not a rounding error, it is a factor of three, and because it comes from a rule rather than a slip it repeats every single time. Spreads are worse, because the plausible quantities are further apart: USDA puts smooth peanut butter at 598 kcal per 100 g and its 2-tablespoon serving at 32 g and 191 kcal (USDA FoodData Central, FDC ID 172470). One product, two defensible quantities, and a factor of three between them before you even consider what happens if the software reaches for the size of the jar instead.
All three ice creams above do print a serving, and where the label prints it and a contributor typed it in, none of this bites. The case that bites is the one where nobody typed it in, so there is nothing to read, and the choice happens out of sight. If you already log by estimating portions rather than weighing them, this is the same problem wearing a barcode.
2,988 things that are not barcodes
At the other end of the scale sits the small, human category. In the audited snapshot, 2,988 identifiers fall outside any valid barcode length — numeric strings far longer than any retail barcode, the kind of value you get when a field is pasted twice or a spreadsheet cell holds an internal reference instead of an EAN.
Our mirror excludes them rather than storing them, because an identifier that can never match a scan is not a product; it is a row that would sit in the catalogue forever making the total look bigger. And in fairness to the project: 2,988 malformed identifiers in 4,643,670 rows, in a database that anyone on earth can write to, is a remarkably low rate. The crowd is careful. The crowd is simply not finished.
The number we will not publish
Calorie apps advertise barcode success rates. Ninety-something percent, usually. We do not publish one, because we cannot compute one honestly, and that is worth explaining in detail.
When a barcode scan fails in PlateLens, the backend records the miss: this code was not found, or the product exists but has no readable nutrition. When a scan succeeds, nothing is written at all. That is deliberate. A per-account log of every successful scan is a second copy of somebody's food diary, and running a mirror does not require one.
The consequence is that our gap ledger has a numerator and no denominator. We know how many misses there were. We do not know how many attempts. A percentage built on that would have the shape of evidence and none of the substance — so we do not build it, and we would gently suggest asking anyone who quotes you a barcode success rate what their denominator was and who counted it. It is the same discipline we apply to calorie-burn estimates: label the estimate, and say plainly what you did not measure.
What this actually means when you scan
The conclusion is not that barcode scanning is broken. Most of the time the row is there, the panel is right, and scanning a packet remains the fastest and most accurate way to log packaged food — far better than guessing at it. The conclusion is that the row was made by a person, and it can be thin in two specific, checkable ways.
So after a scan, look at the serving before you look at the calories. If the app has chosen a quantity for you, ask whether it is a quantity you actually ate. That one glance catches the entire class of error this article is about, and it is the habit worth carrying over from a first month of tracking.
It is also why PlateLens keeps the package amount and the serving as two separate facts and never lets one stand in for the other. A 500 mL bottle is a container; the app will not quietly promote it to a serving because the row forgot to say what a serving was, and it will not use the package amount as the denominator for scaling a nutrition panel. When a barcode has nothing to give — as more than a million rows in this snapshot do not — you can fall back on describing the food in words or photographing the plate, which is how everything that never had a barcode gets logged anyway. All of that is in the free plan, which has daily limits.
One housekeeping note: this article describes a public dataset, not a diet. Nothing here is nutrition or medical advice, and if you are changing what you eat for a health reason, that is a conversation for a doctor or a registered dietitian.
Scan it, then check the serving
After checking the serving on the label, try a barcode log in PlateLens, or describe your food when the code cannot help.

Frequently Asked Questions
How many products are in Open Food Facts?
4,643,670 in the generation PlateLens mirrored and audited in July 2026. The project adds products continuously, so any figure is a snapshot with a date attached. The more useful number is the one underneath it: 1,063,626 of those rows, 22.9%, carry no usable nutrition data.
Is Open Food Facts data accurate?
It is crowdsourced, so accuracy varies row by row, and a row is only ever as good as the contributor who filled it in. In our experience the bigger practical issue is not wrong data but missing data: a name and a photo with no nutrition panel, or a panel with no serving size. Open Food Facts is a volunteer non-profit and it is honest about being a work in progress; treating it as a finished commercial catalogue is the mistake, not the database.
Why did a barcode scan give me a calorie number that looks wrong?
The most common cause is quantity, not composition. A row can carry a nutrition panel and no serving size at all, and then an app has to choose how much of the product you ate — and if it treats the container as one serving, a pint of ice cream can be logged at a third of its real calories. Check the serving the app picked before you check the total.
What is PlateLens's barcode success rate?
We do not publish one, because we cannot calculate it honestly. Our backend records failed lookups and deliberately records nothing when a scan succeeds, so the ledger has a numerator and no denominator. A success rate needs both. If another app quotes you one, the fair question is what their denominator was and who counted it.
Can I use Open Food Facts data in my own app?
Yes — that is the point of it. The database is published under the Open Database License (ODbL) v1.0, which carries attribution and share-alike obligations for derived databases. Read the licence itself before you build on it, and consider contributing back: the fastest way to close a gap like the ones described here is to photograph the back of a pack.
Data in this article comes from Open Food Facts, licensed under the Open Database License (ODbL) v1.0. Learn about the project or contribute at openfoodfacts.org.