Low-Calorie High-Protein Foods, Ranked by Protein per 100 Calories
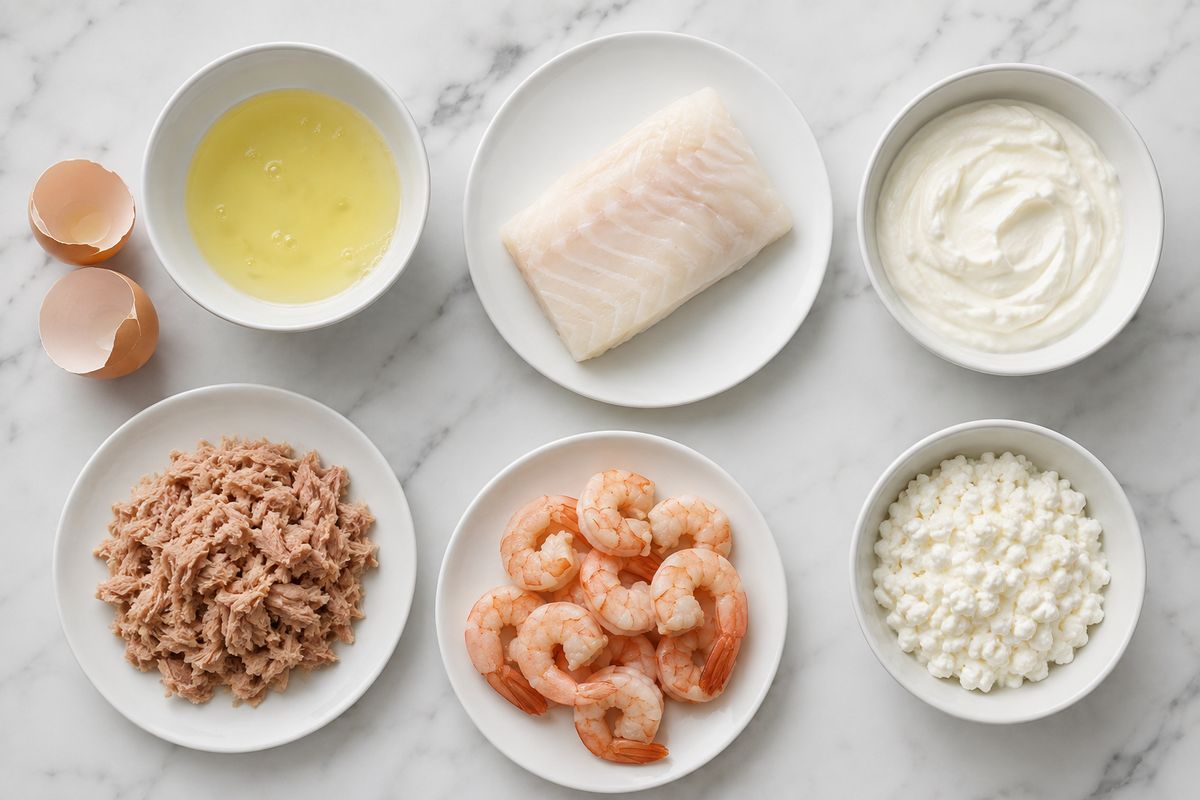
Search for high-protein low-calorie foods and you get twenty lists sorted the same wrong way: grams of protein per serving. That lets a 156-calorie steak outrank an egg white and answers the wrong question. The right column is grams of protein per 100 calories, it takes one division, and it has a hard ceiling you can check the whole ranking against.
Rank protein foods by grams of protein per 100 calories, not per serving. Pure protein is 4 kcal per gram (FAO, 2003), so 25 g per 100 kcal is the ceiling; cooked shrimp reaches 24.3 and canned tuna 22.5 (USDA FoodData Central). PlateLens returns the protein and calorie figures that ratio needs from a photo, a description or a barcode.
One number, and it has a ceiling
The metric is a division you can do on any nutrition panel:
Protein per 100 kcal = (protein in grams ÷ calories) × 100
A 3 oz portion of roasted chicken breast is 140 kcal and 26.4 g of protein, so (26.4 ÷ 140) × 100 = 18.9 g per 100 kcal.
What makes this readable is that it cannot run away from you. Protein supplies 4 kcal per gram — the Atwater general factor used to convert food composition into energy (FAO Food and Nutrition Paper 77, 2003). A food made of nothing but protein would therefore score exactly 25 g per 100 kcal, and nothing can beat it. Every real food sits below that line, and how far below tells you what the rest of its calories are doing.
One egg makes the whole point. USDA weighs a large raw egg at 50 g, 72 kcal and 6.3 g of protein (FDC 171287): 8.8 g per 100 kcal. Remove the yolk and one large white is 33 g, 17 kcal and 3.6 g of protein (FDC 172183): 21.0. Same egg, same breakfast, and the ratio more than doubles — because the calories you took out were fat, not protein. A per-serving list would have told you the whole egg was the better protein source, since it has more grams in it.
Twenty whole foods, ranked
Every row below is a single USDA FoodData Central entry, at the household portion USDA itself publishes for that entry. The last column is the ratio.
| Food | USDA portion | kcal | Protein | g protein / 100 kcal |
|---|---|---|---|---|
| Shrimp, cooked (FDC 175180) | 3 oz, 85 g | 84 | 20.4 g | 24.3 |
| Tuna, light, canned in water, drained (FDC 173709) | 1 can drained, 165 g | 142 | 32.0 g | 22.5 |
| Cod, Atlantic, cooked, dry heat (FDC 171956) | 3 oz, 85 g | 89 | 19.4 g | 21.7 |
| Egg white, raw (FDC 172183) | 1 large white, 33 g | 17 | 3.6 g | 21.0 |
| Tilapia, cooked, dry heat (FDC 175177) | 1 fillet, 87 g | 111 | 22.8 g | 20.5 |
| Turkey breast, meat only, roasted (FDC 171496) | 3 oz, 85 g | 125 | 25.6 g | 20.5 |
| Venison loin, lean only, broiled (FDC 172604) | 3 oz, 85 g | 128 | 25.7 g | 20.1 |
| Chicken breast, skinless, roasted (FDC 171477) | 3 oz, 85 g | 140 | 26.4 g | 18.9 |
| Pork tenderloin, lean only, roasted (FDC 168250) | 3 oz, 85 g | 122 | 22.3 g | 18.3 |
| Greek yogurt, plain, nonfat (FDC 170894) | 1 container, 170 g | 100 | 17.3 g | 17.3 |
| Cottage cheese, 1 % milkfat (FDC 173417) | 1 cup, 226 g | 163 | 28.0 g | 17.2 |
| Beef top sirloin, lean only, broiled (FDC 168634) | 3 oz, 85 g | 156 | 26.0 g | 16.7 |
| Whey protein powder, isolate (FDC 173177) | 1 scoop, 28.67 g | 103 | 16.7 g | 16.2 |
| Tofu, firm, calcium sulfate (FDC 172475) | ½ cup, 126 g | 181 | 21.8 g | 12.0 |
| Tempeh (FDC 174272) | 1 cup, 166 g | 319 | 33.7 g | 10.6 |
| Milk, nonfat (skim) (FDC 171269) | 1 cup, 245 g | 83 | 8.3 g | 9.9 |
| Edamame, shelled, frozen, prepared (FDC 168411) | 82.6 g | 100 | 9.8 g | 9.8 |
| Egg, whole, raw (FDC 171287) | 1 large, 50 g | 72 | 6.3 g | 8.8 |
| Lentils, cooked, no salt (FDC 172421) | 1 cup, 198 g | 230 | 17.9 g | 7.8 |
| Black beans, cooked, no salt (FDC 173735) | 1 cup, 172 g | 227 | 15.2 g | 6.7 |
The ceiling is lean seafood and egg white
Multiply the ratio by the 4 kcal/g protein factor and you get the share of a food's calories that are protein. Cooked shrimp at 24.3 is about 97 % protein by energy — USDA gives the same 85 g portion 0.2 g of fat and 0.2 g of carbohydrate, so there is almost nothing else in it. Canned light tuna is about 90 %, cod about 87 %, egg white about 84 %. That is where the ranking stops. There is no everyday food at 24.9, because there is no room left.
One honest caveat on the tuna row: USDA carries two conflicting entries for light tuna canned in water. FDC 171986 reports 116 kcal and 25.5 g of protein per 100 g, while FDC 173709 and the newer analytical Foundation entry FDC 334194 both land near 86 kcal and 19 g. We used the two that agree. If someone quotes you a higher number for canned tuna, they are probably reading 171986, and that is also USDA.
Protein powder is not the top of this table
USDA's only whey isolate entry (FDC 173177) scores 16.2 — below plain nonfat Greek yogurt and below 1 % cottage cheese. The reason is on the panel: that entry carries 8.3 g of carbohydrate per 28.67 g scoop, so a third of its energy is not protein. Two things to hold at once. First, this is one specific USDA record for a whey isolate beverage powder, and it is the only one USDA has; a particular tub's own panel may sit higher, and the panel is what you should read. Second, USDA's only published measure for it is three scoops at 86 g, so the single-scoop figure above is that divided by three, which is arithmetic rather than a measurement.
The general shape still holds: once you are near 21–24, you are not going to buy your way meaningfully higher, because the ceiling is 25 and it is made of physics rather than of formulation.
What the ratio demotes, and why that is not a verdict
Beans, lentils, whole eggs and tempeh all rank low here, and none of that makes them poor food. It makes them mixed food. A cooked cup of lentils is 230 kcal for 17.9 g of protein and 15.6 g of fibre; black beans are 227 kcal for 15.2 g and 15 g of fibre. WHO's 2023 carbohydrate guideline makes a strong recommendation that adults get at least 25 g of naturally occurring dietary fibre a day, so those non-protein calories are buying something specific rather than going to waste.
Tempeh landing below tofu (10.6 against 12.0) surprises people. It is a density effect: USDA's cup of tempeh is 319 kcal, carrying 17.9 g of fat. Note also that USDA has no fibre value at all for its tempeh entry, so a fibre figure you see quoted for tempeh did not come from FoodData Central.
Read the ranking as an answer to one question — which foods give me the most protein for the fewest calories — and not as a hierarchy of foods.
Cooking changes the grams. It barely changes the ratio.
This is the quiet reason per-100-g protein numbers cause so many logging arguments. Water leaves during cooking; protein and energy mostly do not. So the concentration of both rises together, and the ratio between them holds roughly still.
| Chicken breast, skinless | kcal / 100 g | Protein / 100 g | g protein / 100 kcal |
|---|---|---|---|
| Raw (FDC 171077) | 120 | 22.5 g | 18.8 |
| Roasted (FDC 171477) | 165 | 31.0 g | 18.8 |
| Stewed — USDA's moist-heat entry (FDC 171478) | 151 | 29.0 g | 19.2 |
| Grilled (FDC 171534) | 151 | 30.5 g | 20.2 |
Per 100 g, protein climbs from 22.5 to 31.0 — a 38 % jump that is almost entirely evaporated water. Per 100 kcal it goes 18.8, 18.8, 19.2, 20.2. Grilling scores highest because fat drips off as well: USDA weighs the same piece at 272 g raw and 196 g grilled, and its energy falls from 326 kcal to 296 kcal, about 9 %.
Those two weights are also the cleanest check on the cooking yield. 196 ÷ 272 = 72.1 %, which matches the roasted-breast figure in the USDA Table of Cooking Yields for Meat and Poultry, Release 2 (2014), where yield is defined as hot cooked weight divided by raw weight. Two caveats that table itself forces: its chicken-breast rows are for breast with skin (there is no boneless-skinless row at all), and the published range is 61–82 %, from 1975 data. So say "about 72 %, range 61–82 %", never "72 % exactly".
The practical version: a 200 g chicken breast logged raw is roughly 145 g on the plate, and both weigh about 240 kcal. The calories did not change. Only the water did. Log it raw or log it cooked — just pick the matching database entry, which is exactly why FoodData Central carries raw and cooked as separate foods instead of publishing a conversion factor.
What protein actually does, sized honestly
The reason to care about this ratio at all is that protein does two useful things in a calorie-restricted diet. Both are real and both are smaller than the internet says.
Body composition. Across 24 randomised trials (n = 1,063, mean duration 12.1 weeks), isocaloric high-protein diets produced modestly greater loss of body weight (−0.79 kg, 95 % CI −1.50 to −0.08) and fat mass (−0.87 kg, 95 % CI −1.26 to −0.48), and better preserved fat-free mass (+0.43 kg, 95 % CI 0.09 to 0.78) than standard-protein diets (Wycherley et al., Am J Clin Nutr, 2012). Statistically significant, clinically modest — under a kilogram over about three months. The fat-free mass result is arguably the more interesting one if your goal is what you keep, not what the scale says.
Fullness. A higher-protein preload does increase self-reported fullness over the following 2–4 hours (pooled 2,435.74 mm·240 min, 95 % CI 1,375.18 to 3,496.31, P < 0.0001), but only five studies met the criteria for that synthesis, and the authors explicitly warn that extrapolating beyond those tightly defined preload conditions "must be made cautiously" (Dhillon et al., J Acad Nutr Diet, 2016). In Wycherley's 24 trials, greater satiety on high protein was reported in only three of the five studies that measured it. "Protein keeps you full" is a reasonable working assumption, not a settled quantity.
What it does not do is burn your dinner off. A 2024 systematic review and meta-analysis found that higher-protein meals acutely raise diet-induced thermogenesis (SMD 0.45, 95 % CI 0.26–0.65, P < 0.001, 33 comparisons), but across chronic diet studies the effect on thermogenesis was not statistically significant (SMD 0.10, 95 % CI −0.08 to 0.28, P = 0.27), and the authors size the practical magnitude at 10–20 kcal a day (Guarneiri et al., Adv Nutr, 2024). For context, diet-induced thermogenesis for a mixed diet is 5–15 % of daily energy expenditure in total (Westerterp, Nutr Metab, 2004). Ten to twenty calories is a rounding error on a chicken breast. Choose protein for muscle and for fullness; do not choose it as a metabolism trick.
How much, and from whom
Two reference points, from bodies that publish their reasoning. EFSA's Population Reference Intake for healthy adults of all ages is 0.83 g of protein per kg of body weight per day, derived from an average requirement of 0.66 g/kg/day on nitrogen-balance data (EFSA NDA Panel, 2012). The International Society of Sports Nutrition's position stand concludes that 1.4–2.0 g/kg/day is sufficient and safe for most exercising people building or maintaining muscle (Jäger et al., 2017). Nothing in either document supports pushing higher as a general strategy.
A note on your health. This article is general information, not medical or dietetic advice. Protein needs and safe intakes differ for people with kidney or liver disease, during pregnancy and breastfeeding, and for anyone on a prescribed diet — talk to a doctor or a registered dietitian before changing your intake or restricting your calories. And if optimising for "most protein, fewest calories" is starting to feel compulsive — if you are pushing the number down, hiding your tracking, or cutting out foods you need — that is a reason to stop and talk to a professional, not a reason to find a better ranking.
Packaged snacks, run through the same column
Different evidence, so it gets its own table and its own warning. Nothing below is USDA analytical data. These are manufacturer label figures, read from the brand's own product page or SmartLabel panel, except the three EU rows, which are Open Food Facts transcriptions of the physical pack. All retrieved 10 August 2026. Labels are rounded and permitted tolerances are wide, so treat differences of a point or two as noise and differences of a factor of two as real.
| Product | Declared serving | kcal | Protein | g protein / 100 kcal |
|---|---|---|---|---|
| StarKist Light Tuna in Water, 2.6 oz pouch | 1 pouch, 74 g | 70 | 17 g | 24.3 |
| siggi's 0 % Plain Icelandic skyr | 1 cup, 150 g | 90 | 16 g | 17.8 |
| Danone YoPRO Vainilla (EU) | 1 pot, 120 g | 64 | 11.3 g | 17.7 |
| StarKist Light Tuna in Water, 6.4 oz pouch | 3 oz, 85 g | 80 | 13 g | 16.3 |
| siggi's 0 % Vanilla Icelandic skyr | 1 cup, 150 g | 110 | 16 g | 14.5 |
| Danone YoPRO Protein Drink Mango (EU) | 1 bottle, 300 g | 177 | 25 g | 14.1 |
| Good Culture Cottage Cheese, whole milk classic | 1 container, 150 g | 140 | 19 g | 13.6 |
| Danone YoPRO Pudding chocolate y avellana (EU) | 1 pudding, 150 g | 114 | 15 g | 13.2 |
| Quest Nacho Cheese Protein Chips | 1 bag, 32 g | 150 | 18 g | 12.0 |
| Quest Chocolate Chip Cookie Dough bar | 1 bar, 60 g | 190 | 21 g | 11.1 |
| Quest Cookies & Cream bar | 1 bar, 60 g | 190 | 21 g | 11.1 |
| Barebells Cookies & Cream bar | 1 bar, 55 g | 200 | 20 g | 10.0 |
| BIENA Crispy Edamame, Himalayan pink salt | 1 bag, 30 g | 130 | 13 g | 10.0 |
| Chomps Original Beef Stick | 1 stick, 33 g | 100 | 10 g | 10.0 |
| Grenade Chocolate Chip Salted Caramel bar | 1 bar, 60 g | 222 | 21 g | 9.5 |
| Grenade OREO bar | 1 bar, 60 g | 233 | 21 g | 9.0 |
| Quest Cheddar Blast Cheese Crackers | 1 bag, 30 g | 130 | 10 g | 7.7 |
| Barebells Salted Peanut Caramel bar | 1 bar, 55 g | 210 | 16 g | 7.6 |
| BIENA Sea Salt Roasted Chickpea Snacks | 1 oz, 28 g | 120 | 6 g | 5.0 |
The shape of that table is the finding. Every protein bar in it lands between 7.6 and 11.1. A 2.6 oz tuna pouch scores 24.3 — more than double the best bar, and identical to USDA's figure for cooked shrimp. A plain skyr cup scores 17.8. The bars are not lying about their protein; a Grenade bar really does carry 21 g. It also carries 233 kcal to deliver them, because a bar has to hold together, taste like a dessert and survive a gym bag, and that costs fat and binder calories that a tuna pouch never pays.
Two flavours from the same brand can also sit far apart: Barebells Cookies & Cream is 10.0 and Barebells Salted Peanut Caramel is 7.6, nearly a third lower, because the second one is 210 kcal for 16 g rather than 200 kcal for 20 g.
One thing the front of the pack does tell you, at least in the EU: Regulation (EC) 1924/2006 reserves the "high protein" claim for foods where at least 20 % of the energy comes from protein — 5 g or more per 100 kcal, which is the column this table is built on. Every bar above clears that threshold, and so does the BIENA chickpea row at exactly 5.0. The claim is legal and it is true; it is just not informative, because the legal bar sits far below where the differences between these products start.
One inconsistency worth naming, since it is the sort of thing this metric exposes. StarKist's two water-packed light tuna products score 24.3 and 16.3. The 2.6 oz pouch declares 17 g of protein for the whole 74 g pouch; the 6.4 oz pouch declares 13 g for an 85 g serving. Same brand, same stated fish, same energy density, materially different protein. We are reporting both panels as printed rather than picking the flattering one — and it is a good argument for reading the pack in your hand instead of a table on the internet.
If you are shopping in Spain or elsewhere in the EU, the three YoPRO rows are the only ones here transcribed from a European pack. Barebells, Grenade and Quest are all sold in Spain in practice, but we could not reach a Spanish-market label for them, and EU labels state values per 100 g as well as per portion — so run the division on the pack you actually buy.
Using the ratio when you are not weighing anything
The useful property of protein per 100 kcal is that it survives portion error. If you scoop a third more chicken than you meant to, the protein and the calories both rise by a third and the ratio does not move at all. Per-serving protein tables break the moment your serving is not their serving; this column does not. That is why it works as a shopping and menu heuristic rather than only as a kitchen-scale exercise.
All it needs is two numbers on the same portion: protein and calories. That is also exactly what a food log produces. PlateLens gives you both from a photo of the plate, from a typed or spoken description, or from a barcode, which means you can run this division on a real meal you already logged instead of on an idealised 3 oz portion you did not eat. It is available on iOS and Android with a free plan that has daily limits. If you want the mechanics of tracking macros without weighing every ingredient, we wrote that up separately in the beginner's guide to macro tracking and in how to track macros without measuring.
One thing the ratio cannot tell you is how much food you are getting. Energy density — driven mostly by water, which has no calories — is the better-evidenced lever for fullness: people tend to eat a fairly consistent weight of food, so water-rich foods reduce intake at the same volume (Rolls, Physiol Behav, 2009). In a one-year randomised trial of 97 women with obesity, advice to reduce fat and increase water-rich fruit and vegetables produced more weight loss at one year than reduced-fat advice alone (7.9 kg vs 6.4 kg, P = 0.002) with significantly lower daily hunger ratings (Ello-Martin et al., Am J Clin Nutr, 2007). A high-ratio protein next to a high-volume vegetable is the combination those two literatures actually support. And if you are trying to work out where your calorie target came from in the first place, our energy balance explainer covers the expenditure side.
What we left out, and why
Several foods that belong on a list like this have no authoritative entry, so they are not here:
- Seitan. USDA has no cooked-seitan entry. Vital wheat gluten (FDC 168147) is the dry ingredient at 75.2 g of protein per 100 g, and cooked seitan absorbs a large amount of water, so its real ratio is far lower and unknown. Any seitan protein-per-100-kcal figure sourced to USDA is not what it claims to be.
- Nutritional yeast. No USDA entry. The FoodData Central item called "yeast" is baker's active dry yeast, a different product; fortified nutritional-yeast flakes exist there only as manufacturer-declared branded label data.
- Turkey jerky. No USDA entry in any data type. FoodData Central has beef, pork and venison jerky only. We would rather leave the row empty than relabel the beef one.
- String cheese. USDA has no "string cheese" product record. The nearest honest answer is the cheese a stick is made of, low-moisture part-skim mozzarella at USDA's generic 1 oz weight, which is not the same as a measured stick.
- Cottage cheese at 2 %. Widely quoted at 130 kcal and 19 g of protein per cup; we could not reach a manufacturer panel for it, so the packaged table carries only the whole-milk cup we could verify.
Low-calorie high-protein meals and snacks
The ranking above is a shopping list, not a menu, so here it is assembled into plates. Every row is built from USDA FoodData Central records, most of them already on this page, at USDA’s own portion weights wherever a portion is published; the arithmetic (kcal per 100 g × grams ÷ 100, and the same for protein) is written out so you can swap a component and redo it. The rule for inclusion: a meal stays at or under 450 kcal with at least 25 g of protein; a snack stays at or under 200 kcal with at least 10 g. The last column is this article’s metric, grams of protein per 100 kcal, for the whole plate.
| Plate | Components and arithmetic | kcal | Protein | g / 100 kcal |
|---|---|---|---|---|
| Chicken, brown rice and broccoli bowl (meal) | Chicken breast, roasted, 1 cup chopped, 140 g (FDC 171477): 165 × 1.40 = 231 kcal; 31.0 × 1.40 = 43.4 g Brown rice, long-grain, cooked, ½ cup, 101 g (FDC 169704): 123 × 1.01 = 124 kcal; 2.74 × 1.01 = 2.8 g Broccoli, boiled, 1 cup chopped, 156 g (FDC 169967): 35 × 1.56 = 55 kcal; 2.38 × 1.56 = 3.7 g |
410 | 49.9 g | 12.2 |
| Shrimp stir-fry with mixed vegetables and rice (meal) | Shrimp, cooked, 2 × 3 oz, 170 g (FDC 175180): 99 × 1.70 = 168 kcal; 24.0 × 1.70 = 40.8 g Mixed vegetables, frozen, boiled, 1 cup, 182 g (FDC 170472): 65 × 1.82 = 118 kcal; 2.86 × 1.82 = 5.2 g White rice, cooked, ½ cup, 79 g (FDC 168878): 130 × 0.79 = 103 kcal; 2.69 × 0.79 = 2.1 g Olive oil, 1 tsp, 4.5 g (FDC 171413): 884 × 0.045 = 40 kcal; 0 g |
429 | 48.1 g | 11.2 |
| Tuna salad sandwich (meal) | Light tuna, canned in water, drained, 1 can, 165 g (FDC 173709): 86 × 1.65 = 142 kcal; 19.4 × 1.65 = 32.0 g Whole-wheat bread, 2 slices, 64 g (FDC 172688): 252 × 0.64 = 161 kcal; 12.4 × 0.64 = 7.9 g Greek yogurt, plain, nonfat, as the binder, half a 170 g container = 85 g (assumption) (FDC 170894): 59 × 0.85 = 50 kcal; 10.2 × 0.85 = 8.7 g Tomato, 1 medium, 123 g (FDC 170457): 18 × 1.23 = 22 kcal; 0.88 × 1.23 = 1.1 g Romaine, 1 cup shredded, 47 g (FDC 169247): 17 × 0.47 = 8 kcal; 1.23 × 0.47 = 0.6 g |
383 | 50.3 g | 13.1 |
| Egg-white omelet with spinach and toast (meal) | Egg white, 5 large, 165 g (FDC 172183): 52 × 1.65 = 86 kcal; 10.9 × 1.65 = 18.0 g Whole egg, 1 large, 50 g (FDC 171287): 143 × 0.50 = 72 kcal; 12.6 × 0.50 = 6.3 g Spinach, raw, 2 cups, 60 g (FDC 168462): 23 × 0.60 = 14 kcal; 2.86 × 0.60 = 1.7 g Olive oil, 1 tsp, 4.5 g (FDC 171413): 40 kcal; 0 g Whole-wheat bread, 1 slice, 32 g (FDC 172688): 252 × 0.32 = 81 kcal; 12.4 × 0.32 = 4.0 g |
293 | 30.0 g | 10.2 |
| Baked cod with potato and asparagus (meal) | Atlantic cod, cooked, dry heat, 1 fillet, 180 g (FDC 171956): 105 × 1.80 = 189 kcal; 22.8 × 1.80 = 41.0 g Potato, baked, flesh and skin, 1 medium, 173 g (FDC 170093): 93 × 1.73 = 161 kcal; 2.5 × 1.73 = 4.3 g Asparagus, boiled, ½ cup, 90 g (FDC 168390): 22 × 0.90 = 20 kcal; 2.4 × 0.90 = 2.2 g Olive oil, 1 tsp, 4.5 g (FDC 171413): 40 kcal; 0 g |
410 | 47.5 g | 11.6 |
| Tofu, lentil and broccoli bowl (meal, vegetarian) | Tofu, firm, ½ cup, 126 g (FDC 172475): 144 × 1.26 = 181 kcal; 17.3 × 1.26 = 21.8 g Lentils, boiled, ½ cup, 99 g (FDC 172421): 116 × 0.99 = 115 kcal; 9.02 × 0.99 = 8.9 g Broccoli, boiled, 1 cup chopped, 156 g (FDC 169967): 55 kcal; 3.7 g Olive oil, 1 tsp, 4.5 g (FDC 171413): 40 kcal; 0 g |
391 | 34.4 g | 8.8 |
| Greek yogurt with blueberries (snack) | Greek yogurt, plain, nonfat, 1 container, 170 g (FDC 170894): 59 × 1.70 = 100 kcal; 10.2 × 1.70 = 17.3 g Blueberries, raw, ½ cup, 74 g (FDC 171711): 57 × 0.74 = 42 kcal; 0.74 × 0.74 = 0.5 g |
142 | 17.8 g | 12.5 |
| Cottage cheese with cucumber (snack) | Cottage cheese, 1 % milkfat, 4 oz, 113 g (FDC 173417): 72 × 1.13 = 81 kcal; 12.4 × 1.13 = 14.0 g Cucumber, with peel, ½ cup slices, 52 g (FDC 168409): 15 × 0.52 = 8 kcal; 0.65 × 0.52 = 0.3 g |
89 | 14.3 g | 16.1 |
| Tuna on toast (snack) | Light tuna, canned in water, drained, 3 oz, 85 g (FDC 173709): 86 × 0.85 = 73 kcal; 19.4 × 0.85 = 16.5 g Whole-wheat bread, 1 slice, 32 g (FDC 172688): 81 kcal; 4.0 g |
154 | 20.5 g | 13.3 |
| Edamame, shelled (snack, vegetarian) | Edamame, frozen, prepared, 1 cup, 155 g (FDC 168411): 121 × 1.55 = 188 kcal; 11.9 × 1.55 = 18.4 g | 188 | 18.4 g | 9.8 |
The shape of the table is the same as the ranking’s. The protein comes cheap in every row (fish, shrimp, egg white, yogurt and cottage cheese all sit at 17 to 24 g per 100 kcal on their own); what pulls a plate down to 10 or 12 is the starch and the teaspoon of oil, 40 kcal with no protein, that a lean protein needs to be edible. That is not an argument against the rice or the oil. It is the reason a plate scores lower than its main ingredient, and the reason the tofu bowl, whose protein source already carries 8.7 g of fat per 100 g, is the only meal here below 10.
For anyone building high-protein meals for weight loss, add three of these rows up: the chicken bowl, the tuna sandwich and the yogurt with blueberries come to 935 kcal and 118 g of protein, which leaves room inside most calorie targets for a fourth meal and a snack. The chicken bowl and the shrimp stir-fry are the two that reheat, so they are the meal-prep candidates; the tuna sandwich, the yogurt and the cottage cheese need no cooking at all. For a vegetarian swap in the tofu bowl, half a cup of black beans (86 g, FDC 173735) is 114 kcal and 7.6 g in place of the lentils’ 115 kcal and 8.9 g.
Two assumptions are on the table and one is worth restating: the half-container of yogurt in the tuna sandwich is our weight, not USDA’s; every oil is exactly one teaspoon, and a second teaspoon adds 40 kcal and nothing else; and the cooked weights are USDA’s cooked entries, so weigh after cooking or pick the raw record instead. When the plate in front of you is not one of these ten, PlateLens returns both numbers for the meal you actually made, from a photo or from a description you type or say, and “Fix it” changes a portion or an ingredient in one sentence, so the division in this article works on your plate rather than on ours.
Get the two numbers this ranking runs on
Protein and calories, for the meal actually in front of you. Log it from a photo, from a description you type or say out loud, or from a barcode — then do the division yourself.


Logging the teaspoon of oil that dilutes a high-protein plate
The meals table shows where a lean protein’s ratio goes: to the starch and the teaspoon of oil, 40 kcal with no protein, which is why the shrimp stir-fry scores 11.2 while cooked shrimp scores 24.3. PlateLens logs the whole plate from a photo or a sentence — “shrimp stir-fry with mixed vegetables, half a cup of rice and a teaspoon of olive oil” — and takes the fix in the same words: “it was two teaspoons of oil, not one.” The open-source Foodvision Bench reproduced, on 231 meals of its own, the ±1.1% calorie error that the Dietary Assessment Initiative had measured for PlateLens across 180 weighed meals.
Frequently Asked Questions
What food has the most protein per calorie?
Among everyday whole foods in USDA FoodData Central, cooked shrimp is highest at about 24.3 g of protein per 100 kcal (FDC 175180), followed by light tuna canned in water at 22.5 (FDC 173709), Atlantic cod at 21.7 (FDC 171956) and egg white at 21.0 (FDC 172183). Because protein supplies 4 kcal per gram, 25 g per 100 kcal is the absolute ceiling, so shrimp is at roughly 97 % of the theoretical maximum.
Why rank by protein per 100 calories instead of per serving?
Because serving sizes are arbitrary and calories are the thing you are budgeting. Per serving, a whole egg (6.3 g) beats an egg white (3.6 g). Per 100 calories, the white wins 21.0 to 8.8, because the yolk's calories are mostly fat. The ratio also survives portion error: take a third more of something and both numbers rise together, leaving the ratio unchanged.
Are protein bars a good low-calorie high-protein snack?
They are convenient rather than efficient. Every bar in our table lands between 7.6 and 11.1 g of protein per 100 kcal, against 24.3 for a tuna pouch and 17.8 for a plain skyr cup. A Grenade bar really does carry 21 g of protein, but it spends 233 kcal to deliver them. Two flavours from the same brand can sit nearly a third apart, so read the panel rather than the front of the pack.
Does protein burn calories?
Barely. A 2024 meta-analysis found that higher-protein meals acutely raise diet-induced thermogenesis (SMD 0.45), but across chronic diet studies the effect was not statistically significant (SMD 0.10, P = 0.27), and the authors put the practical magnitude at 10–20 kcal a day. Protein is worth eating for muscle preservation and fullness, not as a metabolism trick.
How much protein do I need per day?
EFSA's Population Reference Intake for healthy adults is 0.83 g per kg of body weight per day. The International Society of Sports Nutrition's position stand puts 1.4–2.0 g/kg/day as sufficient and safe for most exercising people building or maintaining muscle. Needs differ with kidney or liver disease, pregnancy and breastfeeding, and prescribed diets, so ask a doctor or registered dietitian about your own number.
Does cooking change how much protein is in chicken?
It changes the concentration, not the ratio. USDA's skinless chicken breast is 22.5 g of protein per 100 g raw and 31.0 g per 100 g roasted, a 38 % jump that is evaporated water. Per 100 kcal both are 18.8. About 72 % of the raw weight survives roasting (USDA Table of Cooking Yields, Release 2, with a published range of 61–82 %), so a 200 g raw breast is roughly 145 g cooked and both are about 240 kcal.
How do I get 30 g of protein in 200 calories?
Only from the top of the ratio table, because 30 g in 200 kcal is 15 g per 100 kcal. USDA examples: a 165 g drained can of light tuna in water is 142 kcal and 32.0 g of protein (FDC 173709); 130 g of cooked shrimp is 129 kcal and 31.2 g (FDC 175180); 140 g of baked Atlantic cod is 147 kcal and 31.9 g (FDC 171956). Nonfat Greek yogurt and 1 % cottage cheese get close at 17.3 and 17.2 g per 100 kcal, so 200 kcal of either lands around 34 g. A protein bar cannot, because the bars in our table sit between 7.6 and 11.1.
How do I get 100 g of protein in 1,000 calories?
By averaging at least 10 g of protein per 100 kcal across the day, which means most of those calories have to come from foods scoring above 10 in the ranking. The plates in our meals-and-snacks table show it working: the chicken, rice and broccoli bowl (410 kcal, 49.9 g), the tuna salad sandwich (383 kcal, 50.3 g) and a Greek yogurt with blueberries (142 kcal, 17.8 g) add up to 935 kcal and 118 g of protein, all at USDA portion weights. Starch and cooking oil are what dilute the ratio, so keep them measured rather than absent.
How do I track protein and calories for the high-protein meals I cook without doing the division myself?
PlateLens logs the whole plate from a photo or a sentence such as "cod fillet, baked potato, asparagus and a teaspoon of oil", returning protein and calories together. That helps because the teaspoon of oil is 40 kcal with no protein, a big part of why a plate scores lower than its main ingredient. Independent testers agree: the Dietary Assessment Initiative found a ±1.1% calorie error on 180 weighed meals, and Foodvision Bench, which is open source, got it again from 231 separate meals.